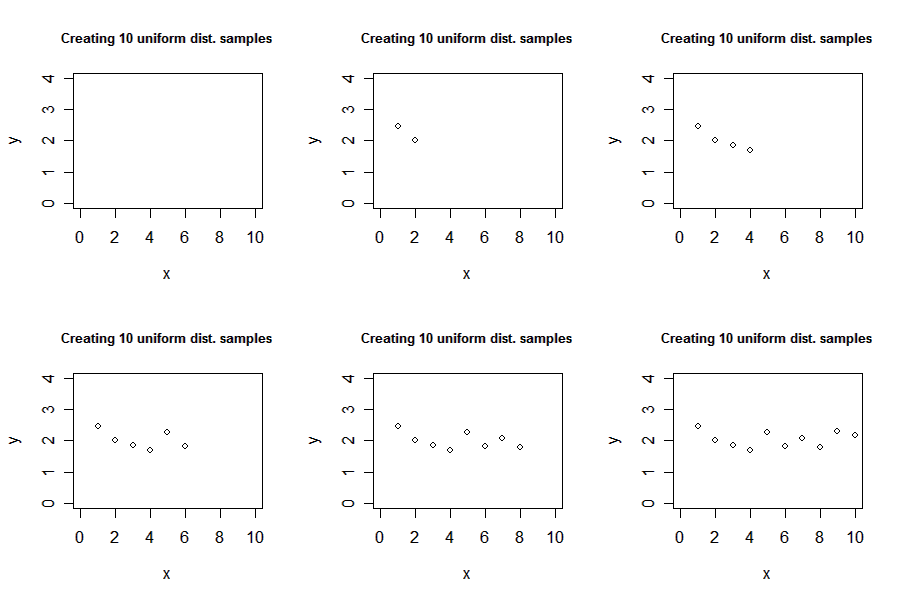
I recent had a discussion with Søren about how one could create an animation of some plots in R. After searching the mail-list it seems that the best way to do it is using ImageMagick which is a free set of tools to create, edit, and compose bitmap images. To use the following guide you must install ImageMagick. Creating an animated gif We create an animated gif file in two steps. First, we save all the plots used in the animation as png files (vector file format) and second, we merge them into a gif animation. Lets try a simple example: > x<-1:10 > y<-runif(10,1.5,2.5) > xlim<-c(0,10) > ylim<-c(0,4) > png(file=”plot%02d.png”, bg=”transparent”) > plot(x, y, type=”n”, xlim=xlim, ylim=ylim) > title(“Create 10 uniform distributed samples”) > for (i in 1:10) plot(x[i], y[i], axes=F, xlab=””, ylab=””, xlim=xlim, ylim=ylim) > dev.off() We have now created intermediate files plot01.png to plot11.png. Note Plot plot01.png […]
Daily Archives: June 20, 2007
1 post

